
Electricity Usage Monitor: Smart Plugs or Whole-Home Tracking?
Choose an electricity usage monitor for your actual question. Compare plug-in meters, whole-home tracking, solar data, installation and ongoing costs.
CompareUs Editorial TeamConsumer utilities editorial team
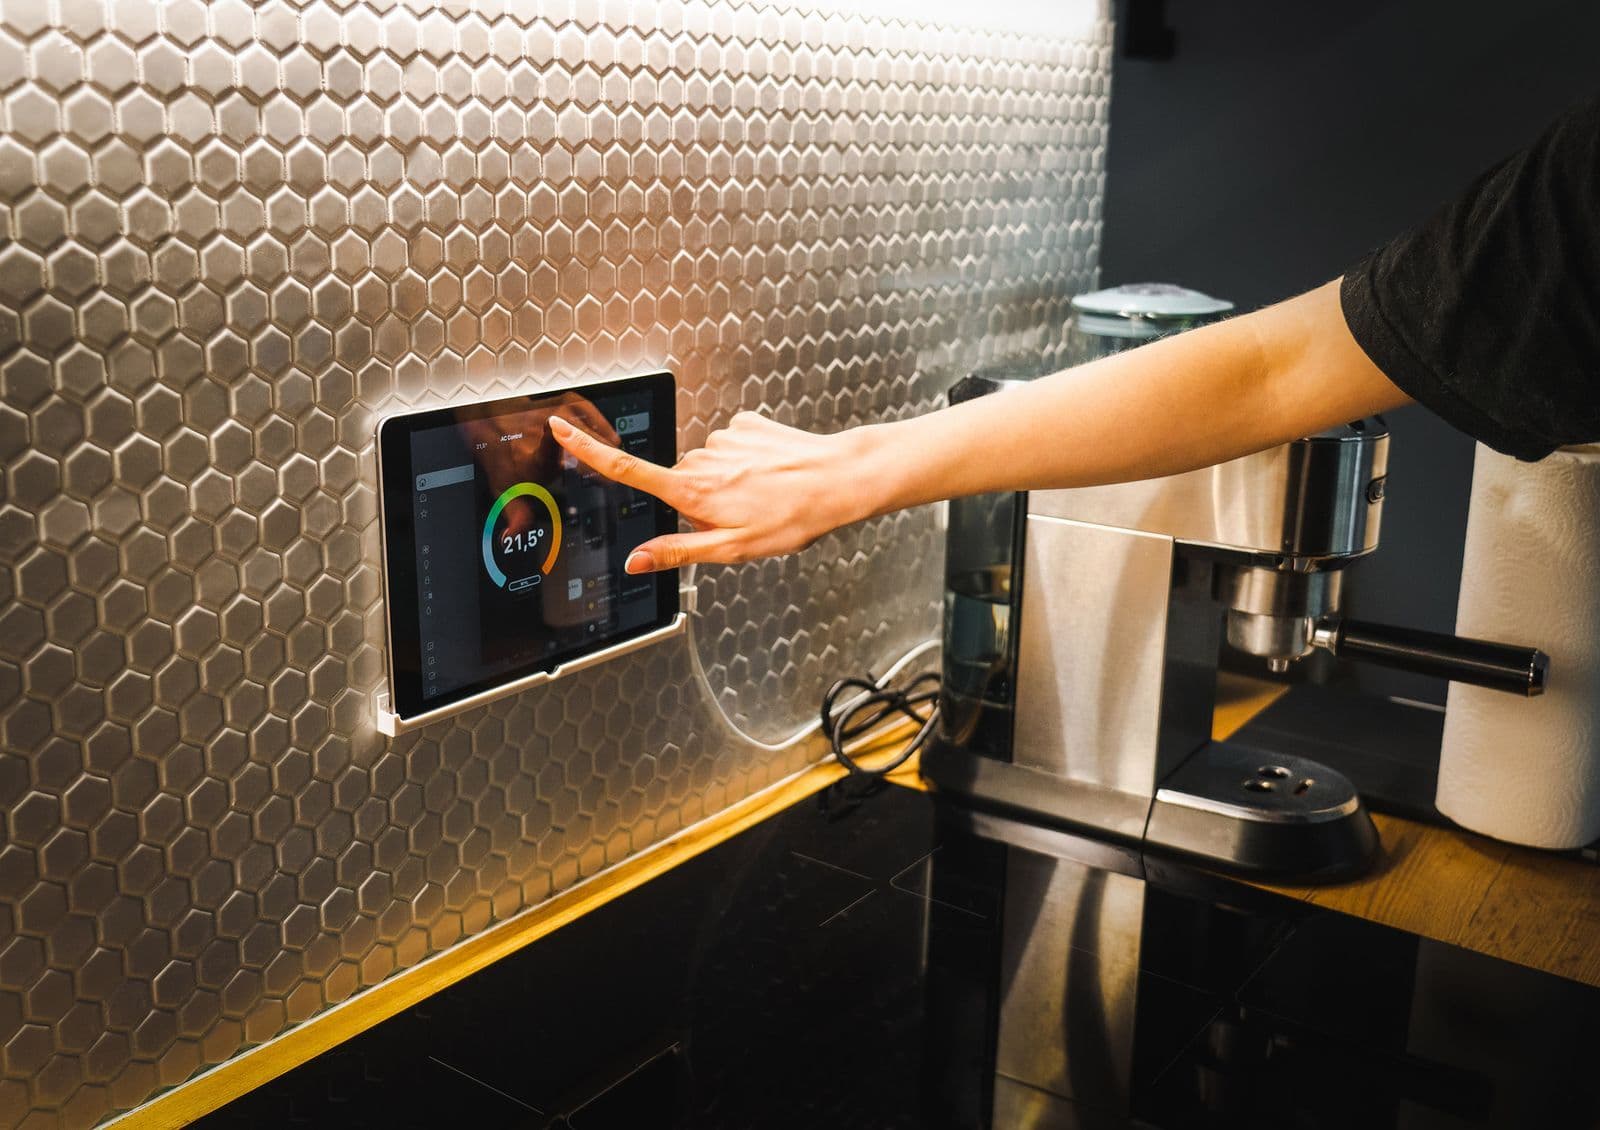
An electricity usage monitor is useful when it answers a specific household question: is the spare fridge expensive, which evening activities overlap, or how much solar electricity do we actually use? Buying the most elaborate dashboard first can leave you with plenty of graphs and no clearer decision.
Quick answer
Choose an electricity usage monitor by the question you need answered. A plug-in meter can measure one suitable appliance; whole-home monitoring can reveal broader patterns; retailer interval data may already be enough. Check installation, load ratings, solar measurement, subscriptions and data access before paying for features you will not use.
Which electricity usage monitor answers your question?
Start by writing one question and the action that could follow. “I want to understand the bill” is a reasonable starting point, but “I want to compare the spare fridge’s measured weekly consumption with the value of keeping it” is easier to investigate.
The Australian Government’s smart-home guidance explains the roles of connected equipment, smart meters and home energy management systems. These are not interchangeable products. A device that switches a lamp remotely does not necessarily measure energy, and a retailer graph does not necessarily identify individual appliances.
| Method | Useful question | Important boundary |
|---|---|---|
| Retailer interval data | When do grid imports rise? | Usually whole-site data, not an appliance diagnosis |
| Suitable plug-in energy meter | How many kWh does this appliance use? | Only compatible plug-connected loads within its rating |
| Whole-home or circuit monitoring | Which circuits and activities drive demand? | Installation and sensor coverage determine what is measured |
| Solar or battery monitoring | Where does generated or stored electricity go? | Some systems show generation without household consumption |
Choose the least complicated method that can answer the question reliably. A paid device is not a prerequisite for every energy-saving decision.
Try the information you already have
Download a bill and look at the retailer’s usage portal before buying hardware. Compare a normal weekday, a weekend and a day when the home was largely unoccupied. Note whether the chart shows kWh per interval, a daily total or an estimated dollar cost.
Our guide to downloading and reading smart-meter data explains how to make that information useful. A sustained overnight load deserves a different investigation from a short evening peak. Neither pattern, by itself, proves which appliance is responsible.
Keep a simple activity diary beside the graph. Record heating hours, laundry cycles, visitors and unusual work-from-home days. This costs little and can reveal whether a more detailed monitor would settle a genuine uncertainty rather than merely produce another version of the same chart.
What to check on a plug-in meter
Look for accumulated energy in kWh, not just an instantaneous watt reading. A cycling appliance can show low demand at one moment and much higher demand when its compressor or heating element operates. Measuring a representative period is more useful than photographing one number.
Check the maximum load, permitted appliance types, operating conditions and instructions for the exact model. Do not assume a physically compatible socket makes every appliance suitable. Follow the appliance manufacturer’s guidance as well as the monitor’s instructions, especially for heating equipment or loads with high starting demand.
Useful practical questions include whether the device retains readings after unplugging, allows a manual reset, displays information without an account and exports a history. A cost display is convenient, but its tariff setting may represent only a flat usage rate. It may not reproduce time-of-use prices, demand charges or supply fees.
Measure a representative period
For a fridge, a short test can miss defrost cycles, hot weather or a busy day of door opening. For a dishwasher, record the program, load and whether drying options were enabled. Compare like with like before deciding a different setting is responsible for the change.
A useful log has five fields: appliance, start and end time, measured kWh, operating conditions and the decision being tested. Add a note if the device lost power or its readings were reset. A tidy measurement record is more valuable than a highly precise-looking number with no context.
Do not disconnect essential medical, safety, communications or food-storage equipment just to create an experiment. Where a test could affect safety or service continuity, ask the relevant professional how to obtain the information safely.
Whole-home monitoring needs a clear scope
Ask the installer what each sensor will measure and which circuits are covered. A whole-home total, selected-circuit readings and individual appliance measurements are different levels of information. An appliance label inferred by software should not automatically be treated as a separate physical measurement.
Discuss single- or three-phase supply, solar, batteries and any controlled-load circuit before accepting a quote. Ask how the system handles electricity flowing in both directions and whether the display distinguishes import from export. Get the intended configuration in writing so the installed result can be checked against it.
Switchboard access and fixed-wiring work belong with appropriately licensed professionals. A monitor advertised as easy to use may still require professional installation. Include installation and any necessary supporting equipment in the cost comparison, not just the retail price of the sensor pack.
Solar generation is not household consumption
The Solar Consumer Guide explains that an inverter’s basic monitoring may show generation, while additional measurement can reveal household consumption and grid flows. A strong generation chart therefore does not, on its own, tell you how much electricity the household avoided buying.
In a simplified period with no battery, suppose solar produces 12 kWh, the home imports 5 kWh and exports 7 kWh. Household consumption is 12 + 5 − 7 = 10 kWh. Self-consumed solar is 5 kWh. These are invented quantities to explain the relationship, not expected performance for a particular system.
With a battery, charging, discharging and losses add more flows. Use the monitoring system’s definitions and ask the installer to explain the energy balance. Do not add every positive number on a dashboard together; some fields may describe the same electricity at different points.
Turn the measurement into a useful cost
For a flat-rate illustration, an appliance using 4.2 kWh in seven days would cost $1.34 at an invented 32 cents per kWh. Multiplying the same weekly pattern by 52 gives about $70 per year. That extrapolation assumes similar conditions all year, which may be poor for seasonal heating or cooling.
The electricity cost calculator can help translate a usage assumption into a cost estimate. Replace sample rates with your own. Daily supply charges normally continue when one appliance uses less electricity, so do not allocate the whole supply charge as an avoidable appliance cost.
On a time-of-use tariff, assign consumption to the relevant windows. For demand pricing, a reduction in an appliance’s kWh may not change the billable maximum. Measurement and tariff calculation are separate jobs, even when an app presents them together.
Compare ownership costs and data access
Write down equipment, installation, subscription, connectivity and replacement costs. Ask what happens if a subscription ends or the supplier discontinues the app. Check whether you can download the underlying data and whether the product remains useful without its cloud service.
Also consider who can access household patterns. Use supported software, account security and the manufacturer’s update process. If a landlord, installer or previous owner set up the account, clarify ownership and access rather than assuming it transferred with the hardware.
A hypothetical $180 setup that leads to a sustained $30 annual saving has a simple six-year payback before subscriptions or replacement. That is not a prediction. If the only likely benefit is a small standby reduction, a costly monitoring system may be difficult to justify purely on bill savings.
Finish with an action, not another dashboard
After a defined test, write one conclusion: keep the appliance, change a setting, investigate a fault professionally, schedule a flexible load differently or compare the tariff. Record the before-and-after conditions so a cooler week is not mistaken for a successful intervention.
If the data points to price rather than consumption, compare electricity options using your actual annual usage and tariff structure. If it points to an unexplained technical problem, show the record to the retailer, installer or qualified tradesperson. The monitor has done its job when it helps you make a better decision.
The CompareUs Editorial Team reviewed the linked government guidance on 28 September 2026. This is a measurement-method comparison, not a laboratory test or endorsement of a particular device.
Where should you go next?
FAQs
Will an electricity monitor automatically lower my bill?
No. It provides information. Savings require an effective change in usage, timing or tariff, and the benefit should exceed the equipment, installation and ongoing costs. Start with the decision you would make differently once you have the data.
Does every smart plug measure electricity?
No. Remote switching and energy measurement are different features. Check the exact model for watts, accumulated kWh, history and export options, as well as its electrical rating and compatibility with the intended appliance.
Can a plug-in monitor measure a hardwired air conditioner?
Not as an ordinary plug-in installation. Hardwired equipment needs an appropriate professional measurement arrangement. Do not open a switchboard, alter fixed wiring or improvise adapters to make a monitor fit.
Why does my solar app differ from my retailer’s usage graph?
They may describe different flows: solar generation, total household consumption, grid imports or exports. Time periods and data delays can also differ. Identify each field before treating the difference as a fault.
Is retailer interval data enough?
It can be enough to identify when grid consumption rises and compare tariffs. It may not identify the appliance responsible or capture total behind-the-meter solar consumption. Use it first, then decide whether a more detailed measurement would change a decision.
Should I buy one monitor for every appliance?
Not automatically. A suitable portable monitor may be moved between compatible appliances for a planned measurement exercise. Whole-home monitoring may suit a different question. Consider total cost and whether the additional information has a practical use.